Tool ASSESSMENT and MAPPING
Experts' corner

This section explains the different elements and steps that a risk assessment for heavy rain induced flooding might consist of. It shows different methodological approaches for these steps and describes their pros and cons as well as demands for data and resources. In-depth knowledge and experiences from implementing different methods in different areas is provided via our lessons-learnt as well as scientific reports from the RAINMAN project.
Get to know the Source-Pathway-Receptor-Consequence Concept
The analysis of heavy rain risk consists of two main analysis steps, each encompassing two sub-analysis-steps:
The HAZARD ANALYSIS shows what kind of precipitation events in terms of volume, duration and intensity might be expected and where surface water might flow and accumulate in the course of a heavy rain event. These two aspects are addressed by the sub-analysis-steps source analysis and pathway analysis.
The VULNERABILITY ANALYSIS locates and quantifies subjects and objects that may be exposed to the flood water and suffer a damage. Such subjects and objects can be people, livestock, buildings, streets etc. Their detailed characteristics are examined in the receptor analysis. The consequences analysis estimates their susceptibility to the negative consequences of the hazard.
The source analysis gives answers to questions dealing with the generation of surface runoff depending on the precipitation event and the processes happening on the surface such as infiltration. Due to this reason we differentiate the sub-steps “Precipitation analysis” and “Runoff generation analysis”. They give answers to the following questions: What type of precipitation events should I expect in my region in terms of volume, duration and intensity and what are typical annual occurrence probabilities or statistical return periods, e.g. the intensity of a rain event that is expected to happen once within a time span of 100 years? How and where is surface runoff generated, e.g. differentiated by land cover/land use as well as soil properties that have an influence on the infiltration of the rainwater?
The pathway analysis describes the processes of surface runoff concentration and runoff routing, i.e. the flow dynamics of the water. It gives answers to questions such as: Which flow pathways does the water take? At what level is the water flowing or ponding? What is the distribution of flow velocities?
The receptor analysis identifies/maps and characterises subjects and objects that might be harmed or damaged by the flood water. Typical questions addressed are: Where are vulnerable subjects and objects? How many are in the affected area, e.g. the number of inhabitants in a certain area, houses, kilometres of roads, sensitive infrastructure elements?
The consequence analysis describes the processes that cause harm and damage to the receptors, e.g. drowning, wetting of building construction elements, erosion of street paving etc. The following questions give an idea of the topics addressed: What can happen to subjects and objects exposed to the floodwater? What damage processes can be expected? What is the relation between the intensity of the flood impact in terms of water level, flood duration and flow velocity and the resulting degree of damage?
HAZARD ANALYSIS
The hazard analysis shows what kind of precipitation events in terms of volume, duration and intensity might be expected and where surface water might flow and accumulate in the course of a heavy rain event. These two points are addressed by the sub-elements source analysis and pathway analysis that are described via questions that give an idea of the according answers or results, respectively, that these steps can provide. Below you can find explanations on the content of the different sub-steps of the hazard analysis.
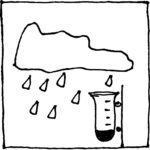
SOURCE ANALYSIS
The source analysis gives answers to questions dealing with the generation of surface runoff depending on the precipitation event and the processes happening on the surface such as infiltration.
Measuring precipitation at points:
Precipitation can directly be measured via the collection of the rainwater and the measurement of its volume. For the measurement of heavy rain events automatically recording devices are needed that have a high temporal resolution. That means that they record the precipitation volume e.g. every minute. Such stations are typically run by the national weather services as well as by local water/wastewater authorities. For the analysis of the precipitation characteristics regarding intensity and duration it is necessary to have a station close (a few kilometers) to your area and in the best case with precipitation time series of some decades.
Analysing precipitation data:
Long term time series of precipitation measurements at points can be used for statistical analysis to get information about the frequency of heavy rain events, their intensities and their durations. Based on these analyses it is possible to calculate occurrence probabilities or return periods for defined events, e.g. showing the intensity of a rainfall of 60 min duration that can be expected once in 100 years. With this information it is possible to a) select a historic event or b) design a synthetic storm event and use this time series to carry out a surface runoff modelling as part of the pathway analyses.
Measuring precipitation over large areas:
A problem of point based precipitation measurements is the often low spatial density of these stations and the missing representativeness for remote areas between these stations. An emerging solution to this problem is precipitation radar. It measures indirectly but with full areal coverage and high spatial and temporal resolution (1 km, 5 minutes) the precipitation. The measurements can be calibrated with point recordings and translated to volume or intensity. Time series of the resulting precipitation raster or maps are available from the national weather services but typically, due to the novelty of this technology, only for a few years in the past.
Analysing large area precipitation data:
Radar-based large area precipitation data is stored in raster maps. Each raster cell can be analysed statistically as if it was a point. A major benefit of rainfall statistics from radar data is their high spatial resolution that covers areas remote from point stations. In addition, the space-time-dynamics of a rainfall event can be studied. During an event it is possible to extrapolate the track of a storm and to use this information for early warning. The stored data can be used to model past observed events and use them to run surface runoff models with a high degree of certainty regarding the rainfall input. Such event data can be especially useful for the quality assurance of the model and for a detailed analysis of what happened in the past as a basis for future prevention and protection measures.
The rainfall on its way to the ground and into the soil passes different “stations” that act as storage or as retardation elements. Vegetation is one such element. The higher the coverage or density of the vegetation and the leaf area, the higher the storage and retardation effect. With regard to high intensity rain events these effects play only a minor role in reducing the precipitation. Another station the raindrops pass is the soil surface and the underlying soil body. There are some general rules regarding the infiltration speed or the volume of water that can infiltrate per unit of time and the amount of surface runoff that is generated. The coarser the soil, the more roots and biopores, the more stable aggregates and pores, the higher the infiltration rate. Fine grained, compacted and crusted soil surfaces and soil bodies have low infiltration rates and generate surface runoff fast. The higher the intensity of a rain event, the lower is the effect of infiltration into the soil. There exist a number of approaches to calculate infiltration and runoff generation ranging from simple empirical/conceptual (SCS-CN, Green and Ampt, Smith and Parlange) to complex physically based approaches (Richard’s equation). The Green & Ampt approach is often implemented in modelling tools for surface runoff modelling, e.g. openLISEM, FullSWOF, etc.
- For high intensity scenarios infiltration might be ignored resembling e.g. an already fully saturated soil due to prior rain events.
- When dealing with low to medium intensity events and when land use measures related to soil and vegetation are to be evaluated, infiltration processes need to be integrated in models.
- New locations for precipitation stations should be representative for the observed area.
- Measurements from station networks often underrepresent the very localized heavy rain events.
- Precipitation statistics are based on past characteristics and do not account for future changes, e.g. due to climate change.
- Climate change will generally lead to more frequent and more intensive precipitation events.
- Simulations with different precipitation events – e.g. a frequent, a rare and an extreme event – can illustrate the different dimensions of the flooding.
- Observed events are good for model quality assurance and calibration as well as for communication (e.g. to show the effect of a measure in relation to an event people have witnessed and that is more real than a synthetic storm).
- Use radar precipitation data in addition to get information about events that happen between stations.
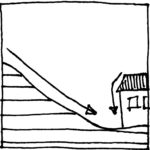
PATHWAY ANALYSIS
The pathway analysis describes the processes of surface runoff concentration and runoff routing, i.e. the flow dynamics of the water. It gives answers to questions such as: Which flow pathways does the water take? At what level is the water flowing or ponding? What is the distribution of flow velocities?
After the rainwater has reached the surface it is transformed to surface water depending on the runoff generation process and the influence of the surface material. The water on the surface follows the slope of the terrain and concentrates in areas where water from different source regions meets. The area that belongs to a point where water can come from is called its catchment. The bigger the catchment area of a point, the higher is the potential amount of water that might reach this point and a high amount of water typically translates to water depth. Slope or steepness of the terrain surface has a strong influence on flow velocity as well as the roughness of the surface, e.g. smooth and “fast” concrete road vs. rough and “slow” dense shrubs. Pathways of concentrated runoff can be known rivers and creeks as well as unknown or barely visible linear depressions that have not been observed as waterways in the past. Especially in flat areas local depressions can fill up and form temporary ponds, a process also known as “ponding”.
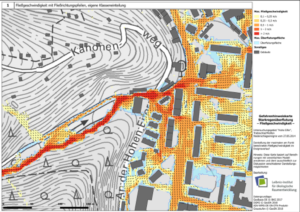
Approaches for a pathway analysis can be flow pathways/runoff accumulation methods as well as the computer-based modelling of the flow of water based on physical principles (hydrodynamic simulation methods). Details about the potentials and limitations of these approaches can be found below.
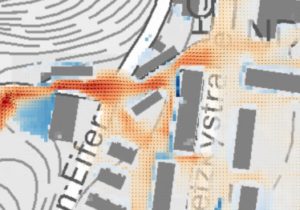
Computer-based modelling of the flow of water. Picture: Axel Sauer, IöR, and GeoSN, dl-de/by-2-0
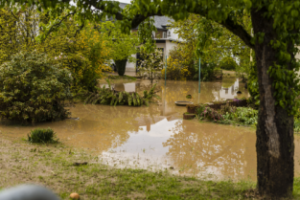
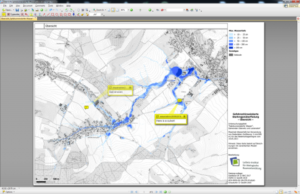
Local depression has filled up with water (ponding). Picture: Municipality of Leutersdorf (district of Spitzkunnersdorf)
- The quality of the results of a computer model-based pathway analysis (topography dependent flow potential as well as rain driven “realistic” flow simulation) strongly depends on the quality of the used digital elevation model.
- The spatial resolution of the digital elevation model should be between 1 and 2 meters.
- Digital elevation models provided by the national topographic survey administrations need to be corrected and enriched with additional information about ditches, culverts, walls and other structures that have an influence on the surface runoff.
- The correction of the digital elevation model should be based on field surveys.
- The corrections of the digital elevation model should be documented precisely and replicable e.g. with a table of the locations, the type of correction carried out as well as before and after screenshots or dataset subsets.
- To reduce the effort and time required for the corrections, a screening simulation with a surface runoff model can be carried out to quickly identify obviously wrong situations such as forming of ponds due to the impoundment of water in front of a wall or embankment that in reality has a culvert or underpass.
- The documentation of observed flow pathways and water levels in maps is very valuable to check if the model is able to simulate an observed flood event.
- For frequent to rare events, a coupling with the sewer system might be helpful to see effects such as draining of uphill areas and/or flooding of downhill areas.
- For high intensity events, the sewer systems and small culverts might be blocked or overloaded, and could be neglected in simulations.
SELECTION OF A SUITABLE METHOD
There are three general types of methods:
Empiric knowledge methods based on observations of past events
Flow pathways/runoff accumulation methods based on an analysis of the terrain surface (as well as statistical methods)
Hydrodynamic simulation methods based on the physical description of the flow of water

The selection of a suitable method for the hazard assessment and mapping requires expert knowledge. Especially in- and output data as well as available resources and further potentials of the mapping activity should be taken into consideration. The method should suit to the spatial scale, i.e. to the size of the area, for which the hazards and risks will be assessed. Furthermore, the method should be chosen according to the objective of the assessment.
The following table provides an overview about the characteristics of the different method types:
| Empiric knowledge methods | Flow pathways/runoff accumulation methods | Hydrodynamic simulation methods | ||
|---|---|---|---|---|
| DATA AND OUTPUTS |
Precipitation Does the method explicitly deal with precipitation and what sources of precipitation data are used? |
YES,
radar data, station data (from meteorological or hydrological services, municipalities, private) |
YES,
a fixed value per cell or cell area |
YES,
radar data, stations, synthetic storms („design storms“) |
|
Runoff generation Does the method deal with the process of runoff generation and how? |
YES,
data source: observed during event (e.g. ponding, runoff) |
NO |
YES,
100% runoff, initial losses, constant losses, infiltration models |
|
|
Water levels / inundation areas Is the method providing information about where and how deep water might flow or stand? |
YES,
observed during event; watermarks after event („on the ground“ or by analysis of aerial/satellite images) |
INDIRECTLY,
by interpretation of accumulation values (the higher, the more water) |
YES,
e.g. in 1 min resolution or aggregated (max. water levels, max. inundation areas) |
|
|
Flow velocity / direction Does the method give information regarding the velocity of the flowing water as well as its directions? |
YES,
observed during event; from watermarks after event (e.g. orientation of grass, debris, sediments, damages) |
INDIRECTLY,
by interpretation of accumulation values (higher values means more water; in combination with steep topography/slope, higher flow velocities) |
YES,
e.g. in 1 min resolution or aggregated (maximal flow velocities) |
|
| EXPENDITURE / RESSOURCES |
Effort What effort do I need to carry out for an analysis in terms of time (and money)? |
LOW to HIGH
depending on coverage/area and intensity/level of detail of documentation |
LOW,
if a digital elevation model exists |
VARIABLE,
depending on the input data (precipitation, infiltration, modified surface model, variants, e.g. blocking culverts) |
|
Knowledge How high are prerequisites regarding professional skills and knowledge for a person to apply the method? |
LOW,
no specific knowledge (guideline/examples in tool integrated) required |
MEDIUM,
basic knowledge in geoinformation systems (GIS) required |
HIGH,
experience in hydrodynamic modelling, GIS knowledge required |
|
|
Costs How high are the costs and what factors have a major influence on the final costs of an analysis? |
VARIABLE,
count with costs for fieldwork, analysis and visualisation (working hours) |
VARIABLE,
count with costs for data, (free software is available), working hours for data pre-processing, calculation and visualisation |
VARIABLE,
count with costs for data, software, working hours for data preprocessing, calculation and visualisation |
|
| USAGE POTENTIALS | What kind of use cases and further application options do the methods have? | Event management, awareness building, damage documentation | Quick „first guess“ | Measures, scenarios, „real“ dynamics, dynamic visualisation |
Let the RAINMAN experiences guide you...
In RAINMAN, a large number of different methods were tested in areas of different size and under different spatial conditions. Have a look at the results and gained experiences: Select examples using a specific type of method and suitable for a specific spatial scale or specific objectives.
Methods for areas smaller 20 km²:
- Heavy rain hazard map: Flow pathway analysis for the City of Meissen (Germany) [pdf; 402 KB]
- Critical points analysis for South Bohemia (Czech Republic) [pdf; 226 KB]
- High-resolution excess water hazard and risk mapping of agricultural areas in Tiszakécske (Hungary) [pdf; 897 KB]
- High-resolution excess water hazard and risk mapping of agricultural areas in Kunhegyes (Hungary) [pdf; 1.53 KB]
- Integrated heavy rainfall risk maps for the City of Graz – Catchment Annabach (Austria) [pdf; 260 KB]
- Integrated heavy rainfall risk maps for the City of Graz – Catchment Stufenbach and Stiftingbach (Austria) [pdf; 362 KB]
- Integrated heavy rainfall risk maps for the City of Graz – Catchment Schloss Eggenberg (Austria) [pdf; 220 KB]
- Integrated heavy rainfall risk maps for the City of Graz – Catchment Katzelbach (Austria) [pdf; 223 KB]
- Guideline for numerical simulations for surface flow induced by heavy rain events in Upper Austria (Austria) [pdf; 192 KB]
- Heavy rain risk map for Umag river estuary (Croatia) [pdf; 677 KB]
- Heavy rain risk map for Zagreb (Croatia) [pdf; 278 KB]
- Heavy rain hazard map based on hydrodynamic simulations with HiPIMS for the City of Meissen (Germany) [pdf; 183 KB]
- Heavy rain hazard map based on hydrodynamic simulations with Hystem-Extran for the City of Meissen (Germany) [pdf; 624 KB]
- Heavy rain hazard map based on hydrodynamic simulations with OpenLISEM for the City of Meissen (Germany) [pdf; 494 KB]
Methods for assessment on a broader scale (many municipalities, counties, regions or even whole states):
- Heavy rain hazard map: Flow pathway analysis for the City of Meissen (Germany) [pdf; 402 KB]
- Statistical assessment of pluvial flood risk for rural areas in Upper Austria (Austria) [pdf; 173 KB]
- Critical points analysis for South Bohemia (Czech Republic) [pdf; 226 KB]
- Flash flood hazard and vulnerability maps for Lower Silesia (Poland) [pdf; 220 KB]
- Mapping of areas vulnerable to soil water erosion – Determination of problem areas in the Czerwona Woda catchment (Case Study) (Poland) [pdf; 344]
- High-resolution excess water hazard and risk mapping of agricultural areas in Tiszakécske (Hungary) [pdf; 897 KB]
- High-resolution excess water hazard and risk mapping of agricultural areas in Kunhegyes (Hungary) [pdf; 1.53 KB]

Methods for assessing depressions that can fill up with water and points that might face intensive surface runoff due to their topographical position:
- Heavy rain hazard map: Flow pathway analysis for the City of Meissen (Germany) [pdf; 402 KB]
- Critical points analysis for South Bohemia (Czech Republic) [pdf; 226 KB]
- How to… prepare a depressionless digital elevation model (and identify ponds) [pdf; 816 KB]
- test data [zip; 6 MB]
- How to… make a flow pathway analysis [pdf; 1 MB]
- test data [zip; 17 MB]
Methods for assessing flow velocities and flow directions occurring at a location based on a certain precipitation event:
- Integrated heavy rainfall risk maps for the City of Graz – Catchment Annabach (Austria) [pdf; 260 KB]
- Integrated heavy rainfall risk maps for the City of Graz – Catchment Stufenbach and Stiftingbach (Austria) [pdf; 362 KB]
- Integrated heavy rainfall risk maps for the City of Graz – Catchment Schloss Eggenberg (Austria) [pdf; 220 KB]
- Integrated heavy rainfall risk maps for the City of Graz – Catchment Katzelbach (Austria) [pdf; 223 KB]
- Guideline for numerical simulations for surface flow induced by heavy rain events in Upper Austria (Austria) [pdf; 192 KB]
- Heavy rain risk map for Umag river estuary (Croatia) [pdf; 677 KB]
- Heavy rain risk map for Zagreb (Croatia) [pdf; 278 KB]
- Heavy rain hazard map based on hydrodynamic simulations with HiPIMS for the City of Meissen (Germany) [pdf; 183 KB]
- Heavy rain hazard map based on hydrodynamic simulations with Hystem-Extran for the City of Meissen (Germany) [pdf; 624 KB]
- Heavy rain hazard map based on hydrodynamic simulations with OpenLISEM for the City of Meissen (Germany) [pdf; 494 KB]
VULNERABILITY ANALYSIS
Vulnerability is a complex and dynamic characteristic of a receptor describing its susceptibility to the negative consequences of a hazard. Receptors are all subjects and objects that may be exposed to the flood water and suffer a damage, e.g. people, livestock, buildings, streets etc. The vulnerability analysis locates and quantifies these receptors as part of the receptor analysis and describes detailed characteristics of the receptors and how they react with damage.

RECEPTOR ANALYSIS
The receptor analysis identifies/maps and characterises subjects and objects that might be harmed or damaged by the flood water.
Typical questions addressed are: Where are vulnerable subjects and objects? How many are in the affected area, e.g. the number of inhabitants in a certain area, houses, kilometres of roads, sensitive infrastructure elements?
In the EU floods directive (e.g. Art. 6.5) the vulnerability of people, economic activities (commercial/industrial buildings and facilities) and the environment covered by “installations as referred to in Annex I to Council Directive 96/61/EC of 24 September 1996 concerning integrated pollution prevention and control (1) which might cause accidental pollution in case of flooding and potentially affected protected areas identified in Annex IV(1)(i), (iii) and (v) to Directive 2000/60/EC;” are mentioned (Floods directive Art. 6.5c).
CONSEQUENCE ANALYSIS
The consequence analysis describes the processes that cause harm and damage to the receptors, e.g. drowning, wetting of building construction elements, erosion of street paving etc.
The following questions give an idea of the topics addressed: What can happen with exposed subjects and objects when exposed to the floodwater? What damage processes can be expected? How is the relation between the intensity of the flood impact in terms of water level, flood duration and flow velocity and the resulting degree of damage?
Consequences in the context of heavy rain induced flooding are e.g. the potential of drowning of people, damages caused to buildings and infrastructure as well as cost for the removal of sediments from buildings and roads. In general, consequences can be summarised as negative effects caused by the impacts of the heavy rain hazards on certain receptors.
MAP GENERATION
The visualisation and the generation of maps is an important task to communicate and to use the results of the hazard analysis and the vulnerability analysis. The following paragraphs show examples which techniques might be used for map preparation and what pros and cons they have.
- Paper maps are static and have to be layouted and printed again after changes, e.g. regarding legend classes, new model runs or updated background maps.
- Paper maps are fixed regarding extent, scale and content.
- Paper maps are independent of an electronic displaying device (and an internet connection).
- Writings/notes on paper maps are easy but difficult to remove or store.
- Paper maps are difficult/expensive to distribute to many people.
- Image-based maps are static and have to be layouted and exported to a file again after changes, e.g. regarding legend classes, new model runs or updated background maps.
- Image-based maps are fixed regarding extent, scale and content but with high resolutions panning and zooming of the map frame is possible.
- Image-based maps need an electronic displaying device (and an internet connection if the file is not saved locally).
- Image-based maps need (lightweight/small) software for displaying.
- Writings/notes on image-based maps are easy if the file is a PDF. Here the comment functions can be used that also allow drawing. Comments can later be exported to a text file and used further, e.g. import to a database.
- Image-based maps are easy to distribute to many people e.g. via download or as an email attachment.
- Image-based maps require little knowledge about the software functions.
- Digital offline interactive maps are dynamic and can freely change visible layers, extent, scale, legend classification and underlying map data sources (vector and/or raster data files). Data must be available for the user.
- Digital offline interactive maps need an electronic displaying device (and an internet connection if the content files are not saved locally, e.g. content that is provided via an OGC webservice such as WMS, WFS or WCS).
- Digital offline interactive maps need (complex/large) software for displaying.
- Writings/notes on offline interactive maps can be made easy via creation of a new spatial layer, setting points with the mouse and writing the text in a form that stores the attribute values of the point geometry. This requires some training/knowledge.
- Digital offline interactive maps require extended knowledge about the software functions.
- Digital online interactive maps are dynamic and can change visible layers, extent and scale (as far as the author of the services allowed/defined this).
- Digital online interactive maps need an electronic displaying device and an internet connection.
- Digital online interactive maps need (lightweight/small) software for displaying but more complex and heavier software on the server/provider side.
- Writings/notes on online interactive maps are difficult and need a specific implementation on the server side to provide such a functionality.
- Select a map type (paper, digital, online) that fits best to your users’ needs. Pros and cons can be found in the sections above.
- You should provide maps with different water level or flow velocity classifications depending on the specific user group.
- A “one map for all” approach is comparable to the “one size fits all” approach. For some it fits well, for many it does not.
- Use a clear name to identify the content of the map.
- Use a version number to avoid discussions about discrepancies caused by changes in the model database that happen in the course of time, e.g. updates/refinements of the terrain data.
- Provide an accompanying document that explains how the map content was prepared, e.g. what model and input data were used and with a description of what interpretations are possible what (knowledge) limits exist.
- For maps with hydrodynamic modelling results, clearly describe the input rain in terms of intensity, duration and return period and if they refer to an artificial or an observed event.
- Colours for water levels should be shades of blue.
- Use transparencies to avoid that the background map disappears “below” the water level layer and orientation becomes difficult.
- Avoid mistakes that let people doubt about the quality of your map content, e.g. water levels within building outlines. Emerging questions such as “Why is there water on the roofs of the buildings?” do not create trust in you maps.
Dealing with uncertainties
Uncertainties during the process of flood hazard mapping have different origins. We have only limited knowledge of the precipitation characteristics (time and spatial pattern), especially when the climate of tomorrow is changing. Flow influencing parameters such as the surface roughness have a high variability in space and time (e.g. changing crop/vegetation cover on fields). We often do not have the highest spatial resolution of digital elevation data or we have to switch to a coarser resolution to keep simulation times in the range of hours to days instead of weeks. In the following we present examples of the effects of such uncertainties on the simulation results.
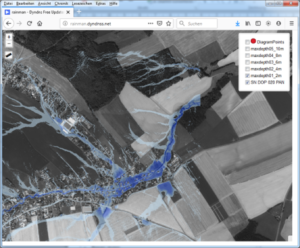
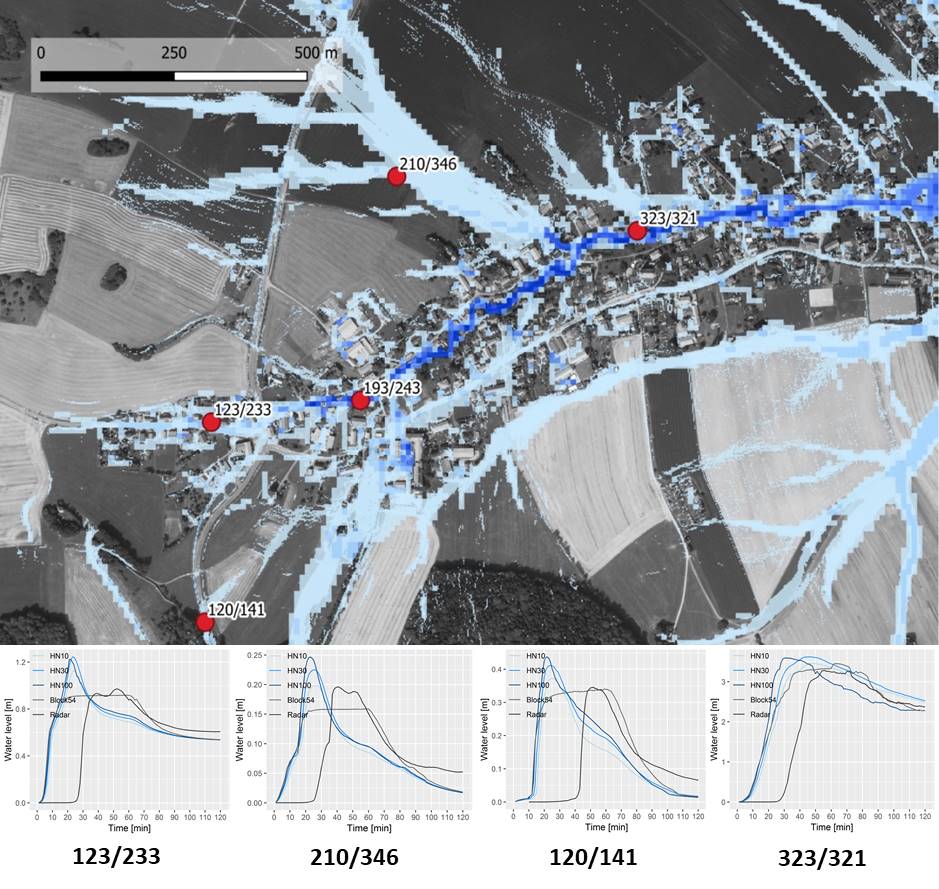
The following map shows the inundation simulated with the 2D hydrodynamic flow model HiPIMS for a subset of the Spitzkunnersdorf (Germany, Saxony) study region and the location of sample points where time series of water levels have been mapped. Five different rainfall inputs can be compared: Three synthetic storms based on the Euler II method with return probabilities of 1 in 10 years (HN10), 1 in 30 years (HN30) and 1 in 100 years (HN100) as well as a so-called block rain (Block54) and the radar precipitation measurement of an observed event (radar). The Euler rains and the block rain are not spatially differentiated and put a homogenous rain field on the catchment. The Euler rains are differentiated over time in contrast to the continuous intensity block rain. The radar rain shows the dynamics in space and time of a real precipitation event.
Picture: Axel Sauer, IöR, and GeoSN, dl-de/by-2-0
Based on their synthetic nature the water level curves of the Euler rains are quite similar regarding their shape. In the upper parts of the catchment the runoff reaction is fast with peak water levels after 20 minutes, in lower parts between 30 and 40 minutes. The rising part of the hydrograph is nearly identical for all rains with a temporal shift of the observed rain due to a different starting time with a longer phase of very low intensities. In this catchment, the peak water levels differ not so much between the different Euler rain return probabilities. In comparison to them the block rain results in substantially lower water levels that stay on a constant level during the precipitation lasts after reaching the peak level. At the downstream point with a deep and narrow riverbed, the resulting water levels are quite close together.
Conclusions
- The rainfall input has a major influence on flow dynamics and water levels.
- It should be stressed that natural precipitation events are highly dynamic and diverse in terms of duration, intensity distribution over time as well as movement directions in space.
- In order to be prepared for probable precipitation events, it is important to simulate a wide variety of rainfall events regarding temporal and spatial patterns and to present alternative maps.
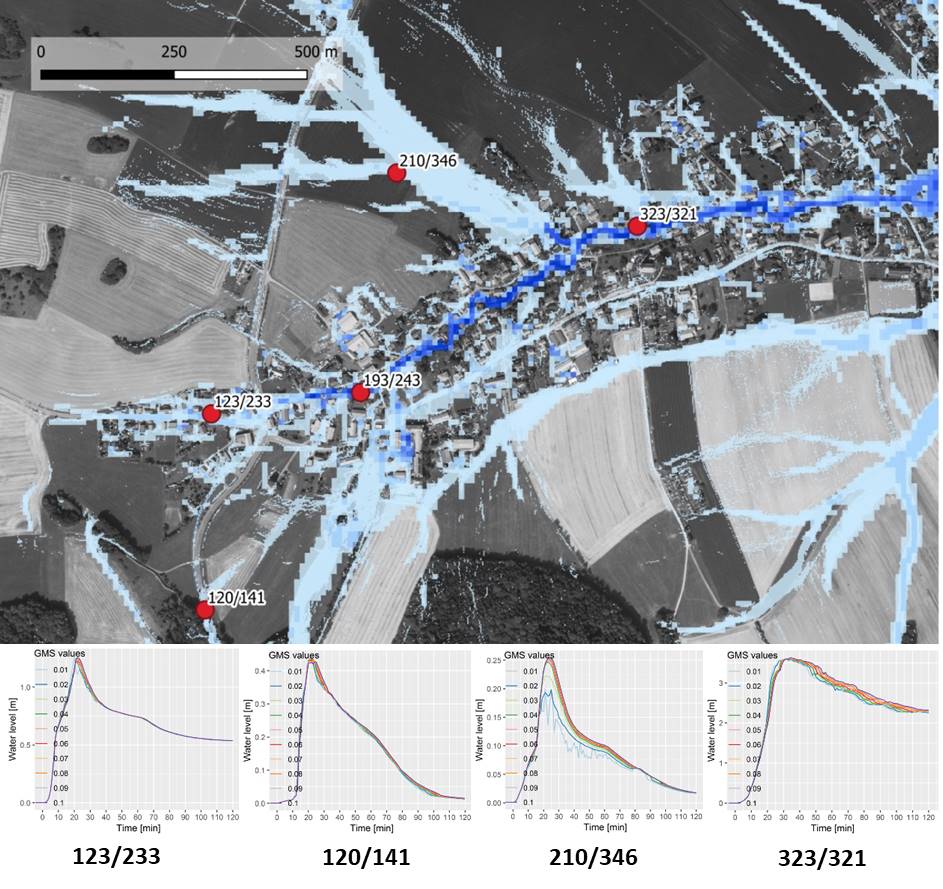
In the following graphics you see the effects of different roughness values on the water levels in the course of time for selected points based on a 1 in 100 years Euler II synthetic precipitation. The Gauckler-Manning-Strickler surface roughness value is for the whole area varied between values of 0.01 and 0.1 in 0.01 steps. The lowest value stands for a very smooth surface such as fine concrete and the highest value for a very rough surface such as a river bed with big boulders or dense shrubs. The GMS value influences the flow velocities and has effects on the water levels and their spatial and temporal distribution.
Picture: Axel Sauer, IöR, and GeoSN, dl-de/by-2-0
For this rainfall scenario and the given catchment characteristics the effects of the different GMS roughness values on the dynamics of the water levels for the selected points are relatively small. The lower roughness values are associated with lower water levels and a slightly steeper rise and earlier peak time due to higher flow velocities. It has to be kept in mind that the flow velocities as an important impact indicator can vary substantially more than the water levels.
Conclusions
- The effort dealing with the roughness parameterisation can be kept smaller if water levels are the primary focus. Nevertheless, simulations of an upper and lower GMS variant provide additional information.
- The lower a point is situated in the catchment or in other words the higher its catchment area is, the more pronounced are the effects of different GMS values especially on time to peak.
- The usage of global, spatially not differentiated GMS values is a (time saving) simplification. Spatially differentiated roughness values based on surface/land use types are closer to reality but might require some additional work.
- Communicate assumptions and possible consequences transparently.
- Use alternative scenarios (precipitation events, functioning / blockings of culverts, changes in surface morphology) to show possible ranges of results.
- Display your results in scales and classes that fit to your modelling accuracies / uncertainties.


